WEBCDR TELECOM BILLING
The Dashboard
Start your 30-day Free Trial
No obligation
A Customizable Dashboard
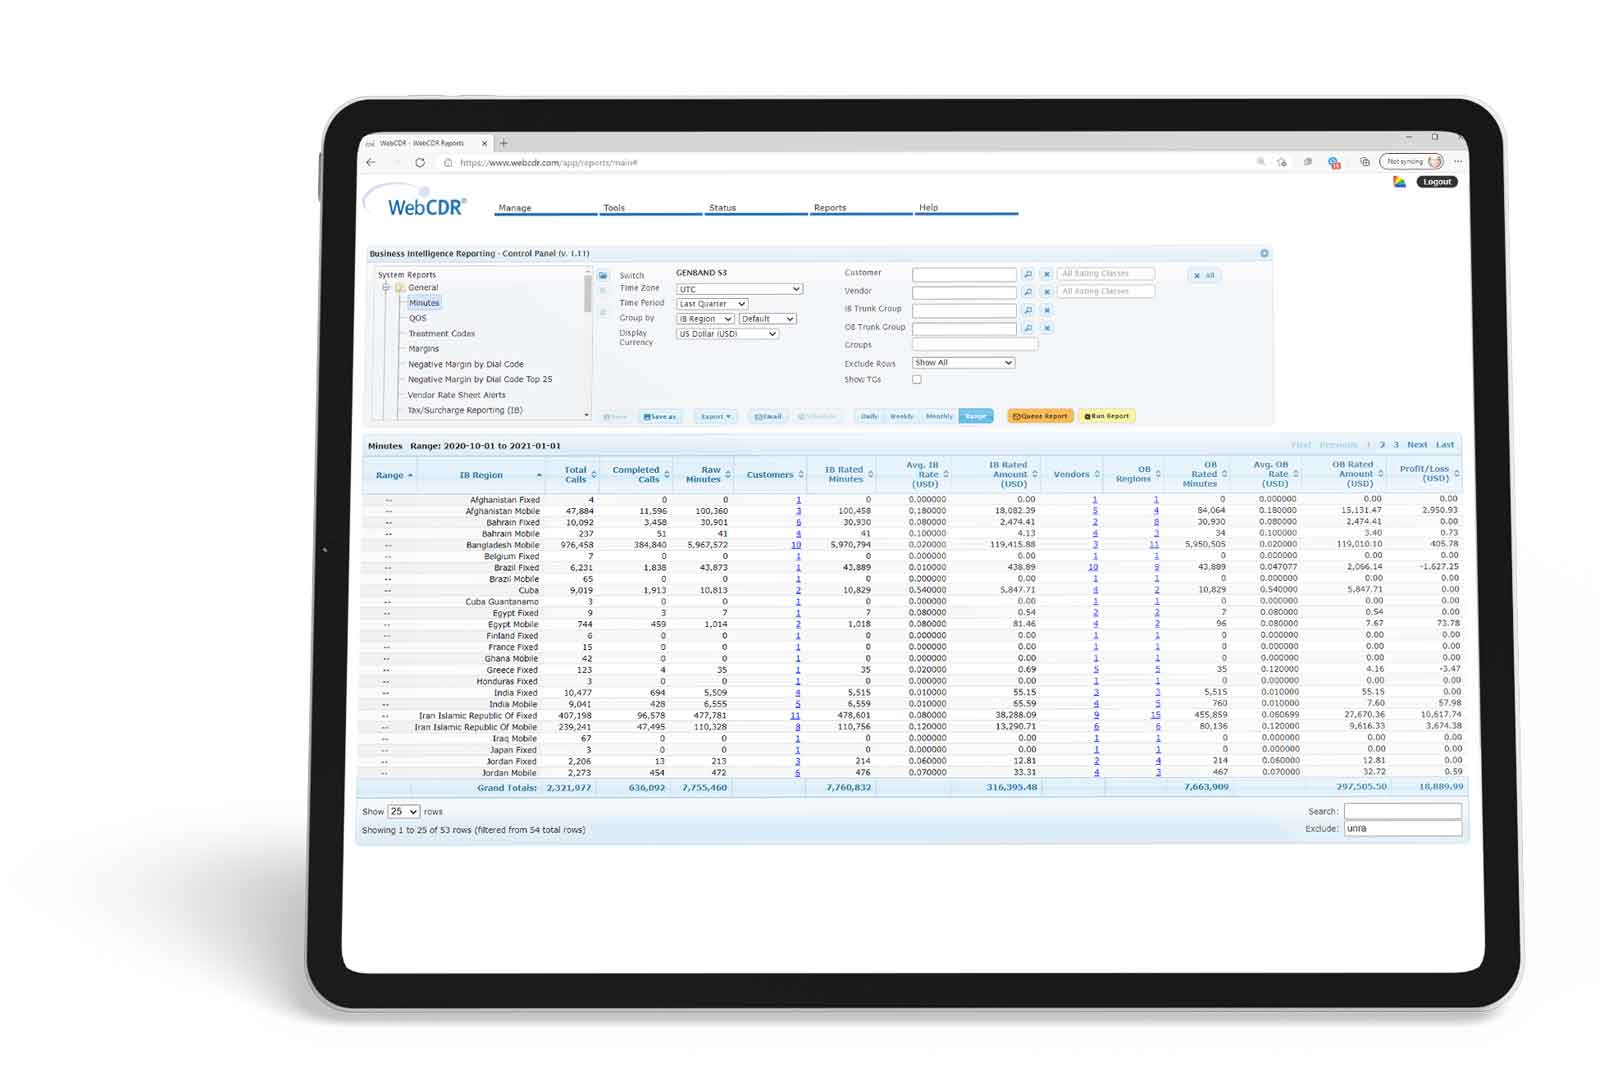
Watch your network's key performance indicators, including QoS, profit margins, and network alarms.28 widgets to choose from, available in more than a dozen different screen layouts, including one just for the iPad.
- 8-in-1: Eight exception reporting widgets combined into one compact control! Green/yellow/red exception indicators monitor IB and OB unrated calls, IB and OB unassigned TGs, long calls, dropped calls, billable calls and reconcilable calls, with numeric data for each.
- Account Status: Shows current backend activity status and any system warning messages.
- Answer Seize Ratio: ASR% summary statistics.
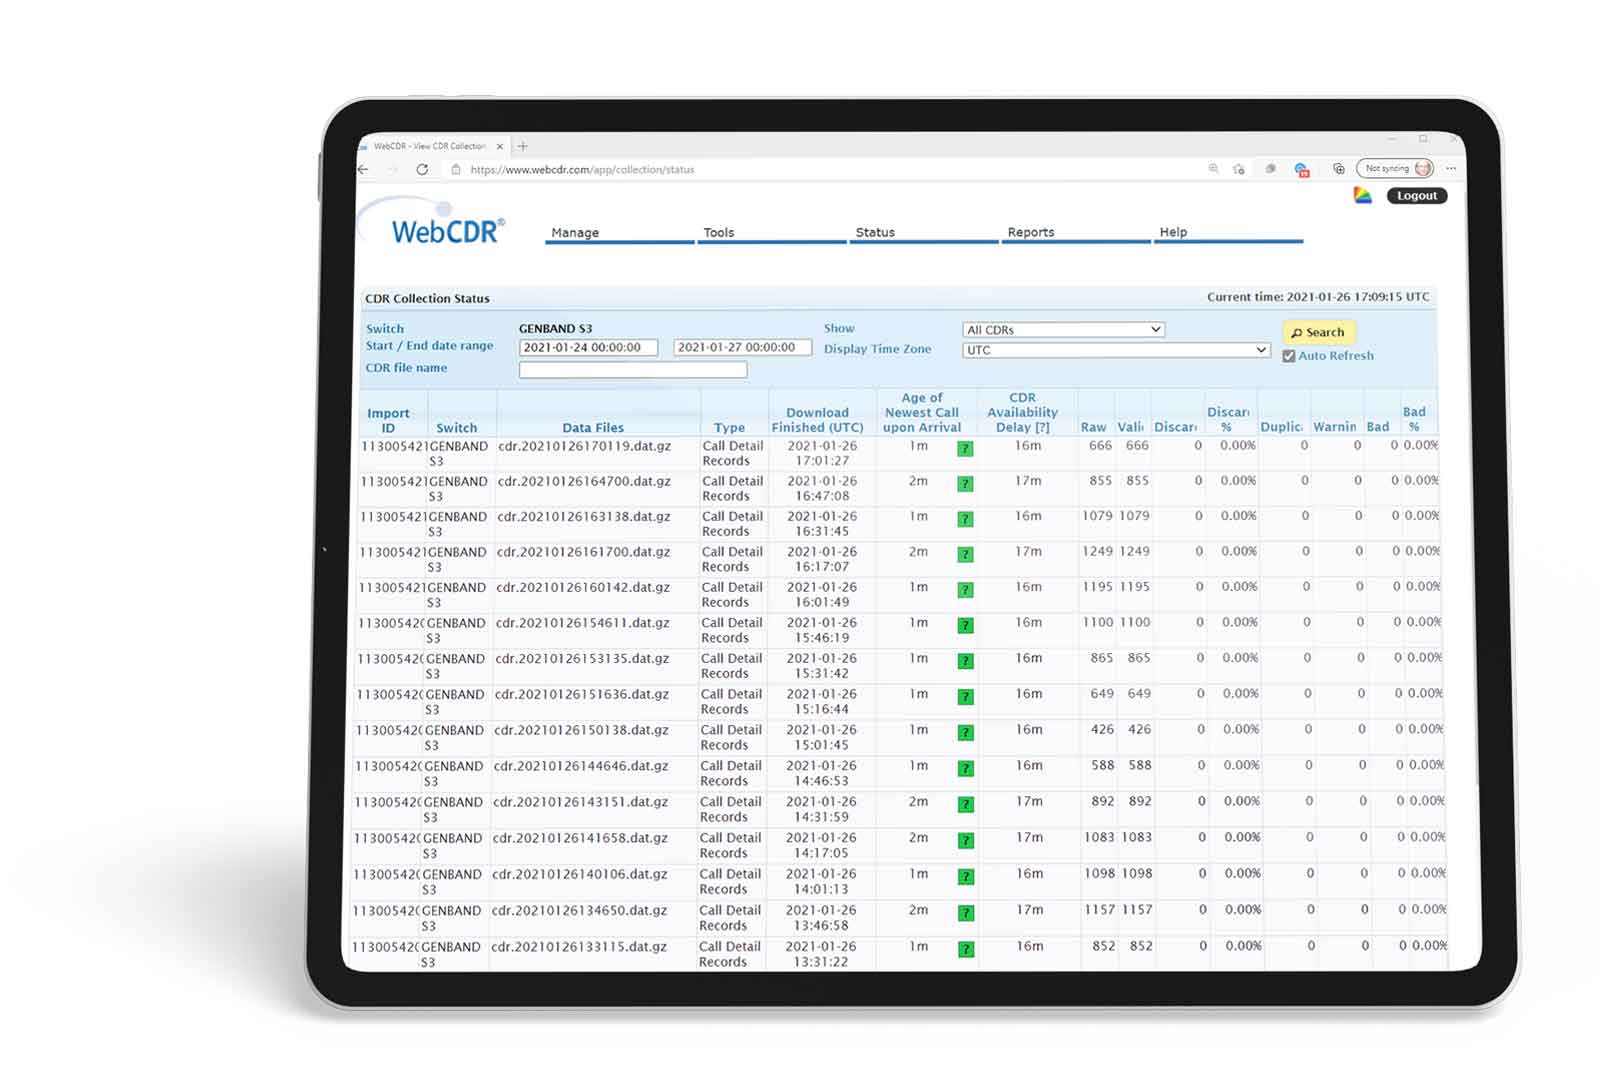
- CDR Collections: Displays elapsed time since the last CDR file was collected from each switch.
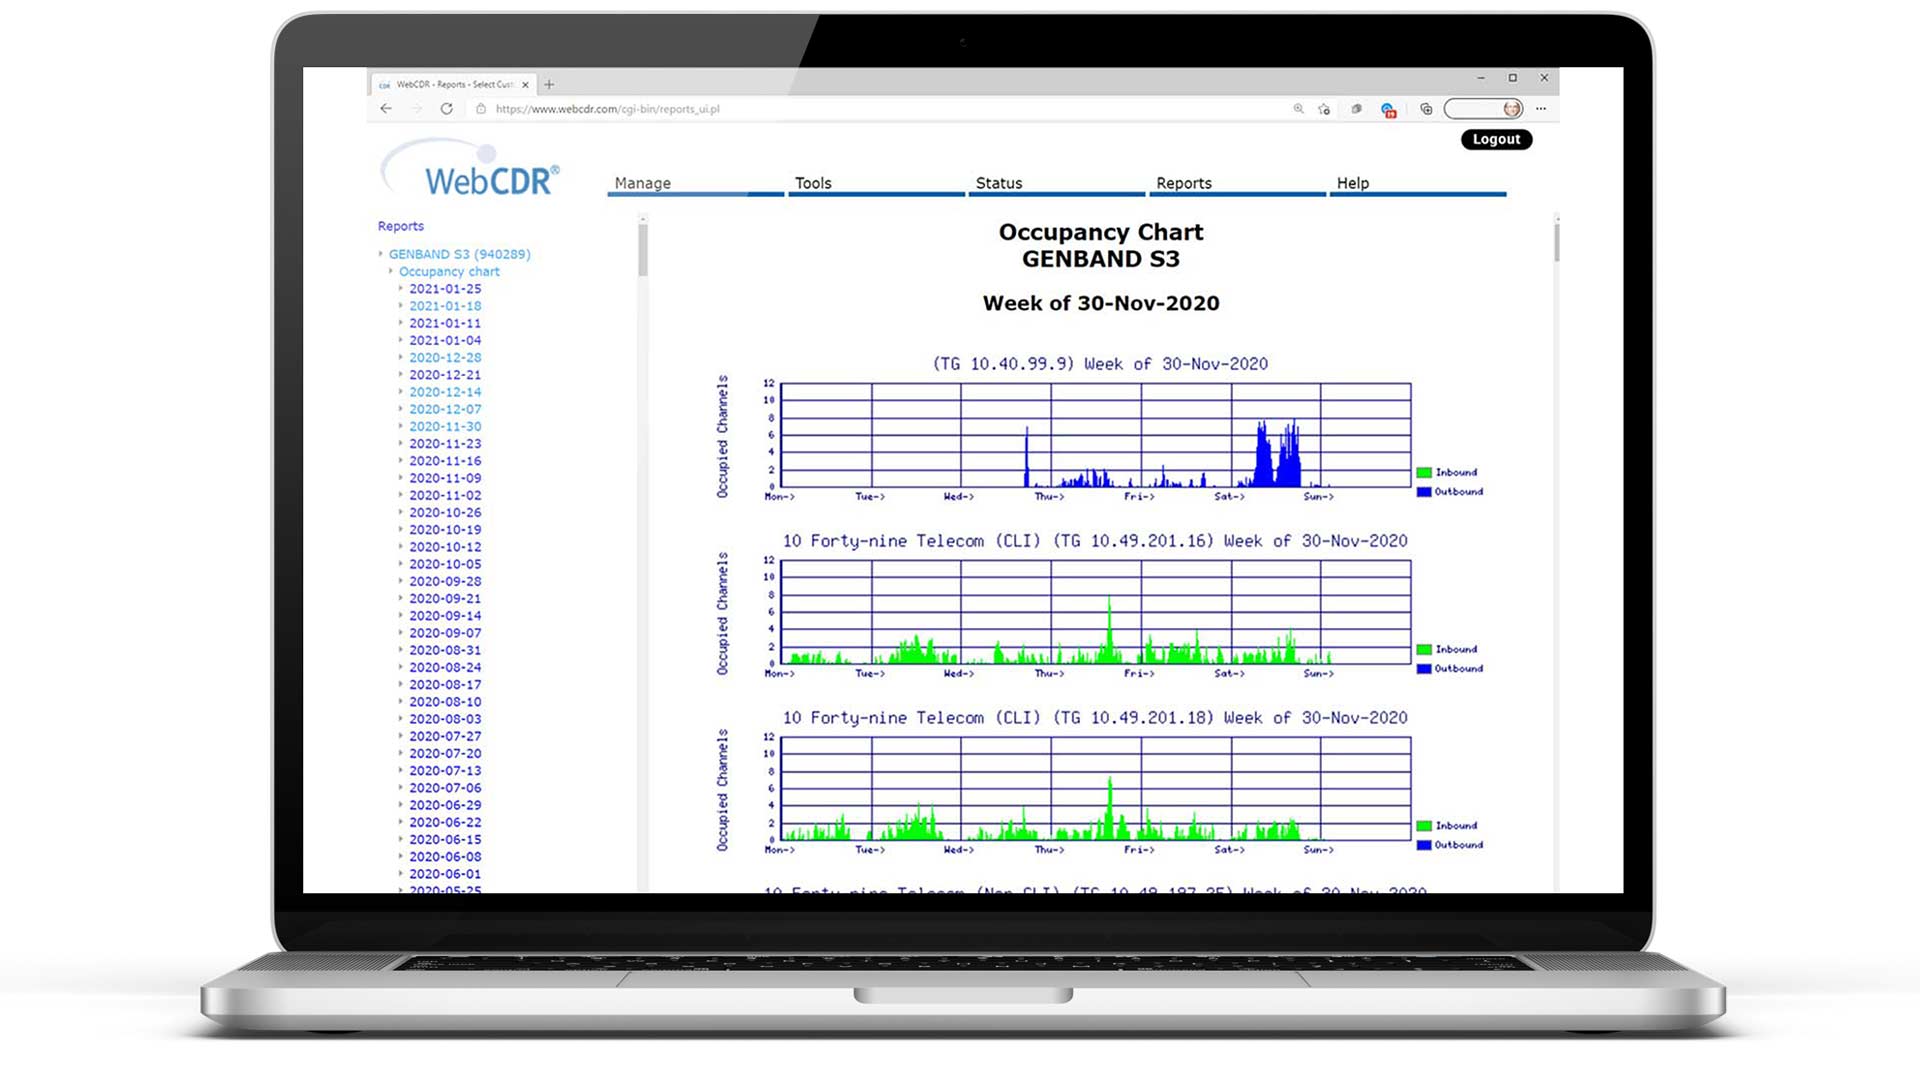
- Calls Chart: A fine-grained chart depicting switch-wide call volume, with bright red exception bars filling gaps where zero calls occurred.
- Dropped Calls: Green/yellow/red exception indicator monitoring potential dropped call events, showing number of calls involved.
- IB Rated %: Green/yellow/red exception indicator monitoring switch-wide rated status of IB calls. Includes total unrated IB minutes data.
- Long Calls: Green/yellow/red exception indicator monitoring calls exceeding three hours, showing number of calls and number of minutes involved.
- Margin Analysis: Summary of switch-wide minutes, revenue, cost, profit, and margin%.
- Margin Chart: Fine-grained bar chart showing switch-wide profit/loss on an hourly basis.
- Minutes Chart: Bar chart showing switch-wide minute volume on an hourly basis.
- News: System-related bulletins from WebCDR.
- OB Rated%: Green/yellow/red exception indicator monitoring switch-wide rated status of OB calls. Includes total unrated OB minutes data.
- Profitability Chart: Displays revenue, expense, and profit together in one color-coded chart.
- Revenue/Minutes: Summary view of switch-wide revenue and minutes.
- Top Customers by Revenue: Pie chart of top customers by revenue.
- Top Customers by Volume: Pie chart of top customers by volume.
- Top Vendors by Expense: Pie chart of top vendors by expense.
- Top Vendors by Volume: Pie chart of top vendors by volume.
- Trading Post: List of single-line advertisements posted by other WebCDR users.
- Traffic Mix: Tabular view of top destinations sorted z-a by minute volume.
- Traffic Offset: Tabular view of top trading partners showing IB-to-OB traffic ratios.
- Unassigned IB TGs: Green/yellow/red exception indicator monitoring switch-wide rated status of IB calls. Includes total unassigned IB minutes data.
- Unassigned OB TGs: Green/yellow/red exception indicator monitoring switch-wide rated status of OB calls. Includes total unassigned OB minutes data.
- Unprofitable Routes: Tabular view of top negative margin routes based on IB-OB dial code pairs, sorted z-a on loss.
- Volume Concentration by Customer: Tabular view of traffic stats by customer.
- Volume Concentration by Vendor: Tabular view of traffic stats by vendor.
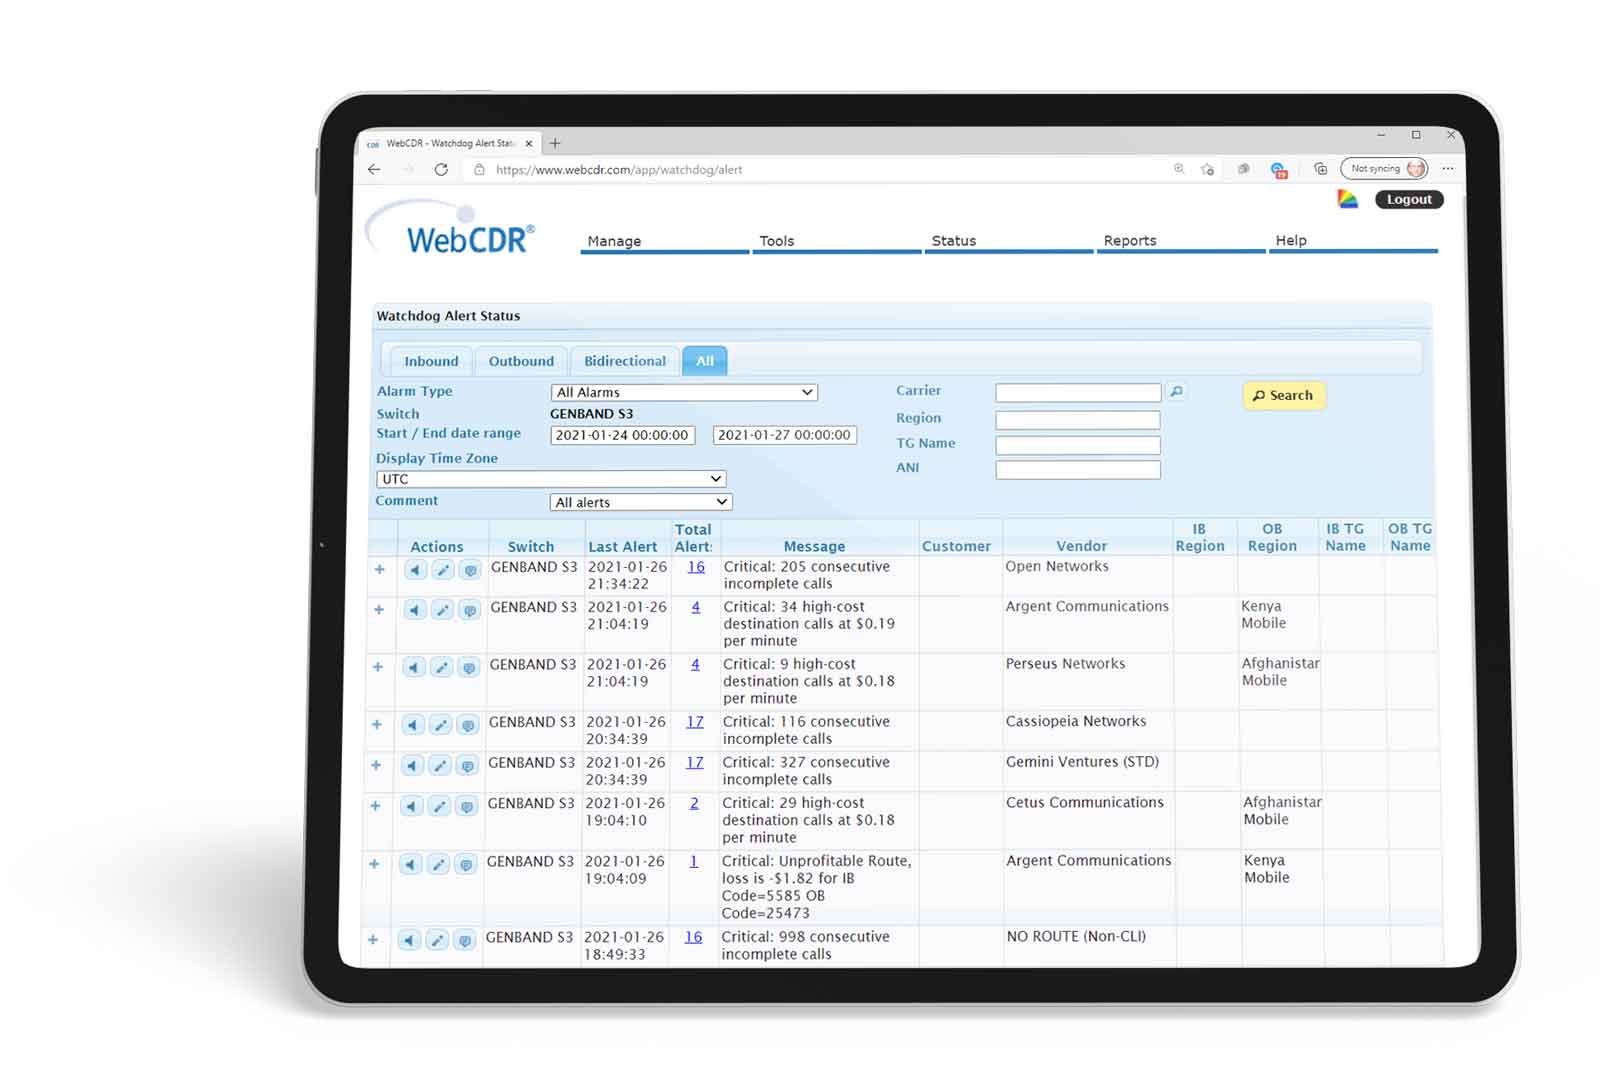
- Watchdog Alarms: Tabular summary (with drill-down links) of recent Watchdog QoS and Anti-Fraud alerts.